First read: about 4–6 minutes. Lecture 1: Introduction to data science.
Data science turns observations into useful decisions. The lecture explains why this requires statistics, programming and sport/health knowledge together, then introduces the lifecycle that structures the rest of the course.
The ideas to keep
Blur the explanations and test yourself.
Three disciplines. Statistics checks patterns and uncertainty; computer science handles data and algorithms; domain knowledge makes the question and interpretation sensible.
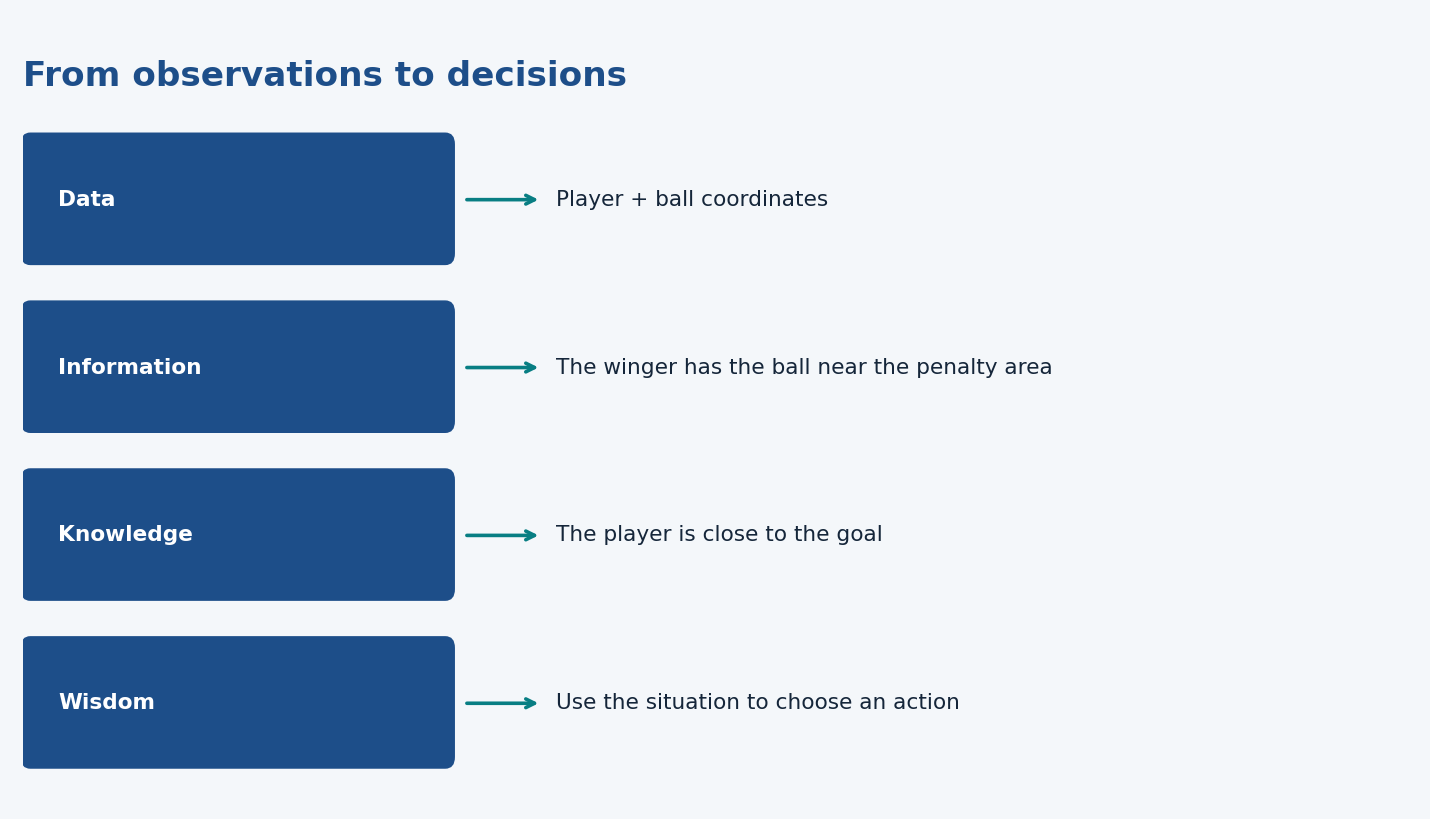
Data → information → knowledge → wisdom. A football coordinate becomes a meaningful location, then an understanding of the situation, then a decision. More raw observations alone do not supply the decision.
Types of data. Structured/unstructured describes organization; quantitative/qualitative describes numerical amounts versus categories. These are separate distinctions.
Explore, then test. Exploring data can generate a hypothesis. Independent confirmation needs more than finding the same pattern again in the same data.
The lifecycle. Problem → acquisition → preparation → exploration → features → modelling → visualization → communication → deployment/maintenance. You can return to earlier steps.
Ask the right question. Predicting a number suggests regression; a known category classification; discovering groups clustering. State the practical purpose before choosing an algorithm.
Responsible work. Understand permissions and privacy, explain limitations, and understand code you submit. The slides also outline the course assignments and exam.
What to be able to do
Be able to name the three disciplines, classify a task or lifecycle step, and explain why collecting data or fitting a model is not enough. The example exams indicate question styles, not an exhaustive syllabus.
Data science turns observations into useful knowledge and decisions. It combines statistics, computer science, and domain knowledge. Statistics helps distinguish patterns from noise; programming makes it possible to obtain, organize and analyse data; sport/health knowledge makes the question and interpretation sensible.
Illustration: a watch records a runner's heart rate. Programming extracts the readings, statistics summarizes how they change with training, and physiology helps distinguish exercise responses from sensor errors. A technically successful analysis can still answer the wrong question if its context is ignored.
The slides define data science as a multidisciplinary field using scientific methods, processes, algorithms and systems to extract knowledge from structured and unstructured data. This covers much more than fitting a machine-learning model. Privacy, responsibility and clearly communicating what data can and cannot tell us are part of the work.
Data → information → knowledge → wisdom
Stage
Meaning
Football example in the slides
Data
Raw observations
Player identifier and coordinates, ball position
Information
Organized observations given meaning
The right winger has the ball at the corner of the penalty area
Knowledge
Understand the situation
The player is close to the goal
Wisdom
Use that understanding to decide
Decide whether to shoot
Coordinates alone do not tell you what action is best. You need the pitch layout, match situation and possible actions. Moving up this ladder involves interpretation, rather than merely collecting more numbers. A decision remains uncertain: being close to goal does not guarantee that shooting is optimal.
Different kinds of data
Structured data follow an explicit organization, such as rows for athletes and columns for age, height and result. Unstructured data include raw video, images and free text. You can derive structured features from them: a video is unstructured, but a table of joint angles extracted from it is structured.
Quantitative data describe amounts, such as time or jump height. Qualitative data describe categories, such as discipline or injury type. These distinctions cross each other. A table can contain both numerical and categorical columns; a video can contain information from which numerical measurements are extracted.
Data ownership is a question to investigate, not something a data scientist can infer from access alone. A participant, device provider, employer and research institution may have different rights and responsibilities. Ask what use is authorized and what privacy obligations apply. The slides pose this as a discussion question rather than giving one universal owner.
Sports applications
Application
Question the data might support
Game analytics
What happened in a match, and which patterns are useful?
Talent identification
Which characteristics relate to future performance?
Training and coaching
How do training and recovery relate to outcomes?
Fan and business applications
What do audiences engage with, and how should services improve?
Player tracking, event classification, technique recognition and performance measurement illustrate these areas. Prediction, explanation and making decisions are related goals but are not interchangeable. Predicting an injury does not by itself establish how to prevent it.
Data science and statistics
The lecture contrasts a traditional hypothesis-first workflow with data-first exploration. This is a useful teaching contrast, not a rule that statistics only tests hypotheses or that data science never uses them.
Hypothesis generation: inspect existing data and notice that athletes with more irregular sleep seem to have worse recovery. You have discovered a possible relationship.
Hypothesis testing: specify that relationship and test it using an appropriate design and preferably new data. Finding a pattern and confirming it on the same observations can exaggerate confidence, particularly after trying many possible comparisons.
A coach may find an exploratory pattern useful immediately; a scientific claim needs stronger checks. In both settings you should communicate uncertainty and alternative explanations.
The data science lifecycle
The stages form a cycle. Results can reveal that you need a better question, more data or different features.
Stage
What happens
Illustration: predicting running time
Identify the problem
Define the purpose, user and target; ask why it matters
Predict a runner's next 10 km time to help planning
Acquisition
Obtain appropriate data from sources
Collect past sessions and race results
Preparation
Clean formats, units, duplicates and missingness
Convert pace and duration into consistent units
Exploration
Inspect distributions and relationships
Plot mileage and performance, inspect unusual values
Feature engineering
Build informative model inputs
Average mileage over a defined prior time window
Modelling
Fit an appropriate method
Train a regression model to predict seconds
Visualization
Show data and results intelligibly
Plot observed against predicted time
Present and communicate
Explain findings, limitations and advice
Tell the coach what errors are typical and when to distrust a prediction
Deployment and maintenance
Put results into use and monitor them
Update predictions and check performance as users change
The lecture expands problem identification most explicitly. Understand the practical objective, consult domain experts, keep asking why, and specify the target. “Use AI” is not a well-defined objective. “Estimate next month's injury risk from information available today” is a more specific question, though its feasibility still needs checking.
Question form in the slides
Typical approach
How much or how many?
Regression
Which category?
Classification
Which group?
Clustering
Is this unusual?
Anomaly detection
Which option should be taken?
Recommendation
Do not confuse a lifecycle stage with an algorithm. Regression is a modelling approach. Cleaning heights is preparation. Explaining a prediction to a coach is communication.
R and the working environment
R is a free programming language/environment with a large ecosystem for statistics and visualization. Its community and packages are advantages. Different packages may offer overlapping functions; handling very large data or complex computations requires attention to performance.
R executes the language. RStudio is an interface around it: code editor, console, environment/history and files/plots/help/packages panes. DataCamp provides guided practice. Community resources can help solve specific problems, but understanding what a solution does is still your responsibility. Python is another widely used data science language; the course focuses on R.
Programming, analytical thinking, domain understanding and communication all contribute to a data scientist's work. The job graphs and historical “sexiest job” headline illustrate the field's growth; they are not numerical facts you need to memorize.
Course information included in the current deck
The current presentation lists nine lectures, six practical labs and a seminar group presentation. The practical work follows the lifecycle: proposal → analysis report → advice/presentation. The grading slide lists proposal 10%, report 30%, presentation 20% and an MC/open exam 40%. Groups of six and obligatory seminars are mentioned.
The deck lists proposal 15 September, report 13 October, presentation 16 October, and exam 20 October. These are what this presentation says, not a fresh audit of every current assignment instruction or your allocated seminar. Check the current course information for logistics; this pack is for learning the lecture content.
The generative-AI slide allows assistance with explanations, ideas and getting unstuck. It requires understanding and being able to explain/reproduce submitted work, avoiding blind copying, and including a generative-AI statement in the Assignment 2 report. Use these notes to learn the ideas and practise yourself.
Common confusions
Data volume does not establish quality, usefulness or ethical permission.
A categorical value stored as 1 or 2 does not automatically become a meaningful numerical amount.
Exploration can suggest a hypothesis; it is not automatically independent confirmation.
A model is one stage of a larger process. Useful communication and maintenance matter too.
Slide coverage map
PDF pages 1–6 introduce the staff; 7–33 cover course aims, organization, tools, AI use and grading; 34–42 introduce data and ownership; 43–61 cover the definition, data-to-wisdom ladder, disciplines, applications, scientific workflow and skills; 62–69 cover the lifecycle, problem identification and closing actions. Staff portraits, illustrative job graphics and repeated transition slides are retained in the full presentation.
Worked through the deep dive?Tick it off. Come back to any section whenever you need it.
3Step 3 of 35–8 min
Practice questions
Exactly two original practice questions. These use the concept/application style of the 2024 and 2022–2023 example exams, with new scenarios and values. Try each before opening its answer. The official example exams are on Canvas; save them for a later, exam-style session.
Question 1 — Choose the complete set of disciplines
A research team can process millions of GPS records and fit an accurate model, but gives advice that ignores football tactics. Which combination best describes the expertise a complete data science project needs?
A. Statistics and computer science only.
B. Statistics, computer science and domain knowledge.
C. Domain knowledge and graphic design only.
D. Programming alone, once the sample is large.
Show answer and rationale
B. Statistics, computer science and domain knowledge. Technical processing and modelling do not supply the tactical meaning of the result. Domain knowledge helps formulate useful questions and interpret advice.
How did your answer compare?
Question 2 — Explain the workflow
A physiotherapist wants a tool to estimate next week’s rehabilitation exercise completion from previous records. Give four distinct lifecycle steps, with one action at each. Explain why a finished model is not the end of the work.
Show answer and rationale
One valid answer: define completion and the decision the tool supports; acquire suitable historical records; prepare units/missingness; train and evaluate a prediction model. Exploration and feature engineering would also be valid distinct steps. Then communicate uncertainty, deploy where useful and monitor performance. Rationale: the lifecycle connects a practical need to data, analysis and use; a model can become unreliable or be misunderstood after deployment.